When we offer Social Media Training or Social Media Management one thing we always suggest is that businesses have Google Analytics on their websites so they can see how much traffic is coming via Twitter, Facebook, LinkedIn and organically via google
It gives you a great indication of where the traffics coming from and which method is working for you in terms of driving traffic to your website, but of course this has to be done in line with research either face to face if you have a physical premises or over the phone to see how they first heard about your business
By way of an example let’s have a look at week 1 since our own www.altrinchamhq.co.uk website went live

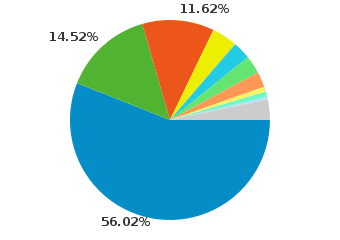
TRAFFIC SOURCES – I.E WHICH SOURCES PEOPLE ARE COMING THROUGH?
As you can see from the above pie chart most of our traffic came via 3 main sources
* Direct
* Facebook
* Twitter
Some surprises I’m sure for a few of you out there putting more focus on twitter than facebook – remember the Importance Of Facebook Sharing
The reason the direct figure is so high is Google Analytics don’t always track links sent via email (for instance out massive mailchimp email that went out when we launched the site) – but what you can’t see from the pie chart above is there are several other feeds coming in for facebook and twitter with slight different links which make the figures quoted slightly higher than the 3 big chunks… so in reality the traffic is Facebook (18.67%), Twitter (15.34%)
LinkedIn for us so far is relatively small 2.9% while other sources of traffic are Freeindex and 4Networking amongst various mail clients
Traffic Sources are forever changing so this is something businesses need to monitor on either a weekly or daily basis
MAP OVERLAY – WHERE THEY ARE VIEWING IT?
No great surprises here as 96.7% of visitors are from the UK, but interesting to see visitors from the USA, Germany, India, Canada, Romania
Again the majority of the traffic is Altrincham, Sale, Manchester based with the furthest Southern visitor being from Littlehampton and the furthest North being Lancaster
Why is it useful to see where the traffic is coming from? To track offline adverts or online banner ads or features from local specific websites
BROWSER – HOW THEY’RE VIEWING THE WEBSITE?
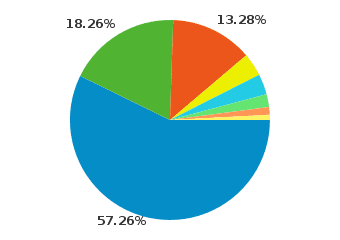
The whole PC vs Mac debate rages on – but from our stats above we can see the majority of users (57%) view on a PC
Interesting nearly 20% of our visitors are on the move via I Phone (green)
The rest of the stats are 13% on Mac and smaller figures for Ipod / Android etc
CONTENT – WHAT PAGES PEOPLE ARE VIEWING?
Altrincham HQ has been in business for over a year now, but we’ve purposefully never had a website until now – the reasons of which you can read about here
So naturally in this first week the pages visited were About Us and Testimonials so they can get a real feel for what we do
The Blog‘s however are heavily read and as they’re updated each week they will become a large focus of the service we offer
TIME ON SITE – HOW LONG ARE PEOPLE STAYING?
The stickiness of the site is really important to business.
On the first week the average time for visitors is just over 3 mins – the length of the perfect pop single and the average attention span for most.
Interestingly digging a little deeper those visitors that came via facebook tended to stay longer than those from twitter
AND NOW OVER TO YOU….
Let us know a little bit more about your business in terms of Social Media. Which medium is bringing you the most traffic? Is it what you initially expected?


